YFin ance Python is a popular library used for retrieving financial data from Yahoo Finance. It allows developers, analysts, and traders to access stock market data, historical prices, and financial information easily. With YFin ance Python, users can perform financial analysis, build trading strategies, and create data-driven applications efficiently.
What is YFinance Python?
YFin ance Python is an open-source library that provides a simple interface to download financial data.
Key Features
- Access to stock market data
- Historical price data
- Company financials
- Dividend and split information
It acts as a bridge between Python and Yahoo Finance, making financial data accessible programmatically.
Installing YFinance Python
Before using YFinance Python, you need to install the library.
Installation Command
You can install it using pip:
Once installed, you can import it into your Python script and start using it for data analysis.
Basic Usage of YFinance Python
YFinan ce Python is easy to use and requires minimal setup.
Importing the Library
Downloading Stock Data
You can download stock data using the ticker symbol of a company.
For example, to get data for Apple Inc.:
print(data.head())
This will return historical stock data including open, high, low, close, and volume.
Understanding Ticker Symbols
A ticker symbol represents a company in the stock market.
Examples of Ticker Symbols
- AAPL → Apple Inc.
- MSFT → Microsoft
- TSLA → Tesla, Inc.
Using these symbols, YFina nce Python can fetch relevant financial data.
Fetching Stock Information
YFina nce Python allows users to access detailed stock information.
Example Code
info = ticker.info
print(info)
This provides:
- Company profile
- Market capitalization
- Revenue
- Financial ratios
Historical Data
One of the most useful features is retrieving historical data.
Example
print(data)
This data can be used for:
- Trend analysis
- Machine learning models
- Investment strategies
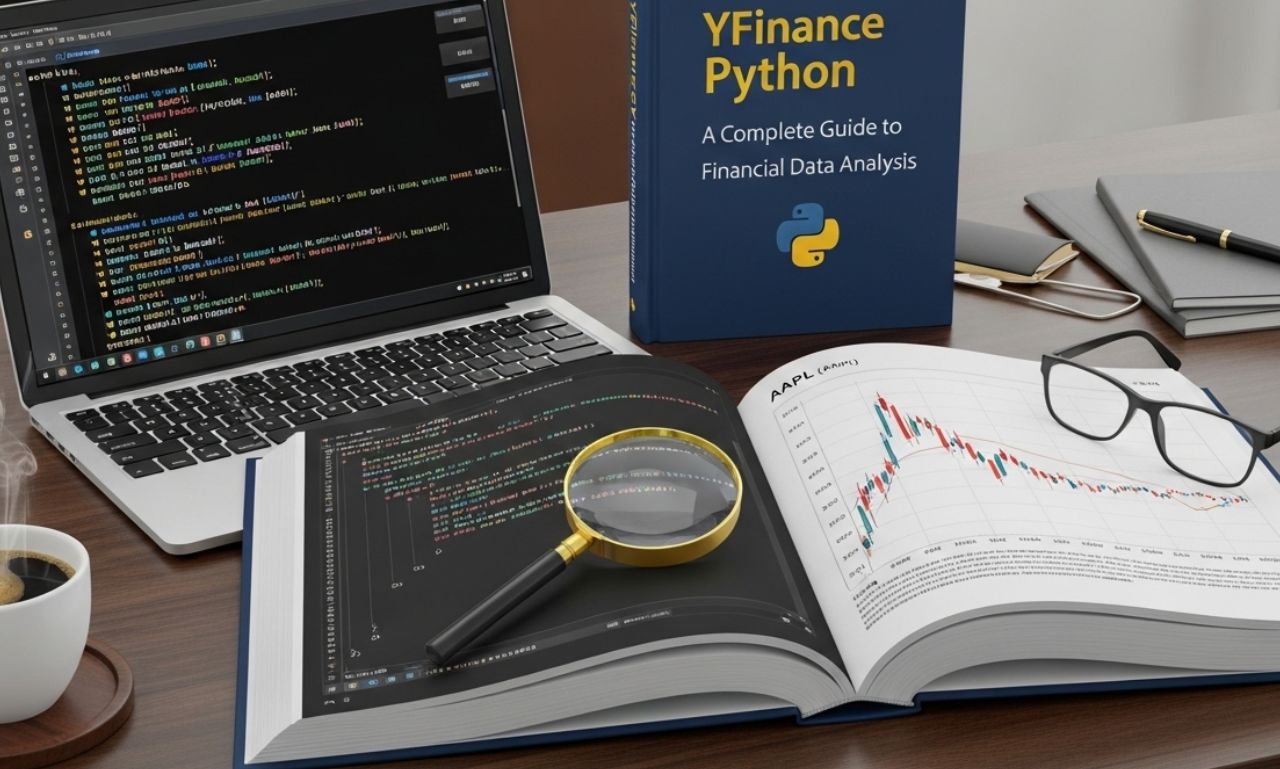
Plotting Data with YFinance Python
You can visualize stock data using Python libraries like matplotlib.
Example
data[“Close”].plot()
plt.show()
This creates a graph of stock closing prices over time.
Financial Analysis Using YFinance Python
YFina nce Python is widely used in financial analysis.
Use Cases
- Stock performance tracking
- Portfolio management
- Risk analysis
- Technical analysis
Indicators
You can calculate indicators such as:
- Moving averages
- RSI (Relative Strength Index)
- Volatility
These help in making informed trading decisions.
YFinance Python and Real-Time Data
While YFin ance Python provides near real-time data, it is not always perfectly real-time.
Limitations
- Slight delays in data updates
- Not suitable for high-frequency trading
Despite this, it is sufficient for most analysis and research purposes.
Advantages of YFinance Python
YFin ance Python offers several benefits:
Easy to Use
Simple syntax makes it beginner-friendly.
Free Access
No subscription is required to access data.
Comprehensive Data
Provides access to:
- Stocks
- ETFs
- Mutual funds
- Indices
Limitations of YFinance Python
Despite its advantages, YFi nance Python has some limitations.
Data Accuracy
Data may sometimes be delayed or incomplete.
Dependency on Yahoo Finance
If Yahoo Finance changes its API, functionality may be affected.
Limited Advanced Features
It may not support very advanced trading tools compared to professional platforms.
YFinance Python in Data Science
YFina nce Python is widely used in data science and machine learning.
Applications
- Predictive modeling
- Financial forecasting
- Data visualization
Integration with Libraries
It works well with:
- Pandas
- NumPy
- Scikit-learn
This makes it powerful for data-driven projects.
Example Project Using YFinance Python
You can create a simple project to analyze stock trends.
Steps
- Import YFinance
- Download stock data
- Clean and process data
- Visualize trends
- Apply analysis techniques
This type of project is common in finance and data science fields.
YFinance Python and Trading Strategies
Traders use YFina nce Python to develop and test strategies.
Common Strategies
- Moving average crossover
- Buy and hold
- Momentum trading
Backtesting
Historical data from YFinance can be used to test strategies before applying them in real markets.
Future of YFinance Python
YFin ance Python will continue to be an important tool for financial analysis.
Future Improvements
- Better data accuracy
- Faster updates
- Enhanced features
Growing Demand
With the rise of data science and algorithmic trading, tools like YFinanc e Python are becoming more valuable.
Conclusion
YFin nce Python is a powerful and easy-to-use library for accessing financial data. It allows users to analyze stocks, build models, and make informed financial decisions. By integrating with popular Python libraries, YFin ance Python becomes an essential tool for both beginners and professionals in finance and data science. Its simplicity and versatility make it one of the best tools for working with market data.